Chapter 1: Events logging
Pre-requisites
Download the Technology Addon for Technology addon for Kafka streaming platform:
https://splunkbase.splunk.com/app/4302
The full and dedicated documentation site:
Splunk configuration
1. Index creation
Create a new index that will be used to store the events from the whole infrastructure.
By default, the Technology Addon uses an event indexed named kafka.
Ensure that the index was created in your environment before you continue.
You can change the index name by customising the inputs provided by the Splunk application.
2. Deployment of the Technical Addon to the Splunk core infrastructure
Deploy the Technology Addon to:
- The indexers (cluster master then push the cluster bundle for clusters, as a normal application for a standalone server)
- Heavy Forwarders if they are being used as intermediate forwarders before reaching the indexers
- Search Heads (SHC deployer if running a search head cluster, as a normal application for a standalone server)
- Deployment Server in deployment-apps to be pushed to the Universal Forwarders
Events logging in dedicated servers (bare metal, VMs)

1. Verify the log4j format in used
The Technology Addon uses the most optimised configuration to guarantee a proper parsing of the events, specially with a perfect management of multi-line events. (such as Java stacktraces)
Sourcetype definitions assume the usage of the default format used by Kafka and Confluent Enterprise/OSS
Example:
[2018-11-20 22:02:15,435] INFO Registered kafka:type=kafka.Log4jController MBean (kafka.utils.Log4jControllerRegistration$)
This relies of your log4j properties files having the following format: (again this is the default format)
DatePattern='.'yyyy-MM-dd-HH
layout.ConversionPattern=[%d] %p %m (%c)%n
If you are relying on a different log format, copy the default/props.conf to local/ and achieve the relevant customization.
Notes: The JVM garbage collector has its own format that is unlikely to be customized
4. Verify and collect log locations of the Kafka components
As logging directories can be customized, and some components may require some minimal configurations to log properly, you first action is to verify, collect and eventually achieve the required changes.
Apache Kaka - Confluent Enterprise / OSS
Zookeeper
By default, Confluent may use the same logging location for both Zookeeper and Kafka brokers, suggested configuration to avoid this:
Configuring the systemd for Zookeeper:
- Edit:
/lib/systemd/system/confluent-zookeeper.service - Configure the logs location with the LOG_DIR environment variable
[Unit]
Description=Apache Kafka - ZooKeeper
Documentation=http://docs.confluent.io/
After=network.target

[Service]
Type=simple
User=cp-kafka
Group=confluent
ExecStart=/usr/bin/zookeeper-server-start /etc/kafka/zookeeper.properties
Environment="LOG_DIR=/var/log/zookeeper"
TimeoutStopSec=180
Restart=no

[Install]
WantedBy=multi-user.target
- Create the log directory:
sudo mkdir /var/log/zookeeper
sudo chown cp-kafka:confluent /var/log/zookeeper
- Restart Zookeeper and verify that logs are properly generated in the directory:
sudo systemctl daemon-reload
sudo systemctl status confluent-zookeeper
Kafka brokers
By default, the Confluent platform generates brokers logs in the following location:
/var/log/kafka
Kafka Connect
Kafka Connect does not log to a file by default, it only logs to the console.
To change this behaviour, you need to edit the log4j configuration:
Configuring the systemd service file for Connect:
- Edit:
/lib/systemd/system/confluent-kafka-connect.service - Configure the logs location with the LOG_DIR environment variable
[Unit]
Description=Apache Kafka Connect - distributed
Documentation=http://docs.confluent.io/
After=network.target confluent-kafka.target

[Service]
Type=simple
User=cp-kafka-connect
Group=confluent
ExecStart=/usr/bin/connect-distributed /etc/kafka/connect-distributed.properties
Environment="LOG_DIR=/var/log/connect"
TimeoutStopSec=180
Restart=no

[Install]
WantedBy=multi-user.target
- Create the log directory:
sudo mkdir /var/log/connect
sudo chown cp-kafka-connect:confluent /var/log/connect
Configuring log4j:
- Edit:
/etc/kafka/connect-log4j.properties - Add a file appender:
log4j.rootLogger=INFO, stdout, FILE

log4j.appender.FILE=org.apache.log4j.DailyRollingFileAppender
log4j.appender.FILE.DatePattern='.'yyyy-MM-dd-HH
log4j.appender.FILE.File=${kafka.logs.dir}/connect.log
log4j.appender.FILE.layout=org.apache.log4j.PatternLayout
log4j.appender.FILE.layout.ConversionPattern=[%d] %p %m (%c)%n

log4j.appender.stdout=org.apache.log4j.ConsoleAppender
log4j.appender.stdout.layout=org.apache.log4j.PatternLayout
log4j.appender.stdout.layout.ConversionPattern=[%d] %p %m (%c:%L)%n

log4j.logger.org.apache.zookeeper=ERROR
log4j.logger.org.I0Itec.zkclient=ERROR
log4j.logger.org.reflections=ERROR
- Restart Connect and verify that the log file is being created:
sudo systemctl daemon-reload
sudo systemctl restart confluent-kafka-connect
schema-registry
By default, the Confluent platform generates Schema registry log in the following location:
/var/log/confluent/schema-registry
ksql-server
ksql-server does not log to a file by default, it only logs to the console.
Notes: By default, the systemd already defines the log directory location, which should already be existing with the correct permissions.
Verifying the systemd service file for ksql:
- Edit: /lib/systemd/system/confluent-ksqldb.service
- Verify the logs location with the LOG_DIR environment variable
[Unit]
Description=Streaming SQL engine for Apache Kafka
Documentation=http://docs.confluent.io/
After=network.target confluent-kafka.target confluent-schema-registry.target

[Service]
Type=simple
User=cp-ksql
Group=confluent
Environment="LOG_DIR=/var/log/confluent/ksql"
ExecStart=/usr/bin/ksql-server-start /etc/ksqldb/ksql-server.properties
TimeoutStopSec=180
Restart=no

[Install]
WantedBy=multi-user.target
- Verify and create the log directory if required:
sudo mkdir -p /var/log/confluent/ksql
sudo chown cp-kafka-connect:confluent /var/log/confluent/ksql
Configuring log4j:
- Edit: /etc/ksqldb/log4j.properties
- Add a file appender:
log4j.rootLogger=INFO, stdout, FILE

log4j.appender.FILE=org.apache.log4j.DailyRollingFileAppender
log4j.appender.FILE.DatePattern='.'yyyy-MM-dd-HH
log4j.appender.FILE.File=${ksql.log.dir}/ksql-server.log
log4j.appender.FILE.layout=org.apache.log4j.PatternLayout
log4j.appender.FILE.layout.ConversionPattern=[%d] %p %m (%c)%n

log4j.appender.stdout=org.apache.log4j.ConsoleAppender
log4j.appender.stdout.layout=org.apache.log4j.PatternLayout
log4j.appender.stdout.layout.ConversionPattern=[%d] %p %m (%c:%L)%n

log4j.appender.streams=org.apache.log4j.ConsoleAppender
log4j.appender.streams.layout=org.apache.log4j.PatternLayout
log4j.appender.streams.layout.ConversionPattern=[%d] %p %m (%c:%L)%n

log4j.logger.kafka=ERROR, stdout
log4j.logger.org.apache.kafka.streams=INFO, streams
log4j.additivity.org.apache.kafka.streams=false
log4j.logger.org.apache.zookeeper=ERROR, stdout
log4j.logger.org.apache.kafka=ERROR, stdout
log4j.logger.org.I0Itec.zkclient=ERROR, stdout
- Restart ksql-server and verify that the log file is being created:
sudo systemctl daemon-restart
sudo systemctl restart confluent-ksqldb
kafka-rest
By default, the Confluent platform generates kafka-rest logs in the following location:
/var/log/confluent/kafka-rest
4. Deployment to the Splunk Universal Forwarders
This assumes that:
- You have deployed a Splunk Universal Forwarder (UF) on each instance to be monitored (Zookeeper, brokers, etc)
- UFs are properly configured and forwarding to your Splunk Indexing layer (
index=_internal sourcetype=splunkdreturns Splunk internal events from the UFs) - Manage deployment to the UFs via a Splunk Deployment server (although you could use any automation tool of your choice)
IMPORTANT: By default, all inputs are disabled and must be enabled depending on your needs
- Extract the content of the Technology Addon archive in your deployment server
example:
/opt/splunk/etc/deployment-apps/TA-kafka-streaming-platform
- Create a local directory, copy the default inputs.conf, enable each monitor input required and achieve any customization required, such as custom paths to log directories:
cd /opt/splunk/etc/deployment-apps/TA-kafka-streaming-platform
mkdir local
cp -p default/inputs.conf local/
- To enable an input monitor:
replace
disabled = true
by
disabled = false
- Finally, create a server class in the deployment server that matches your Kafka infrastructure hosts, associate with the Technology Addon. (ensure to restart splunkd !)
- Once the TA and its configuration has been deployed to the UFs, the logs collection will start immediately.
Verify
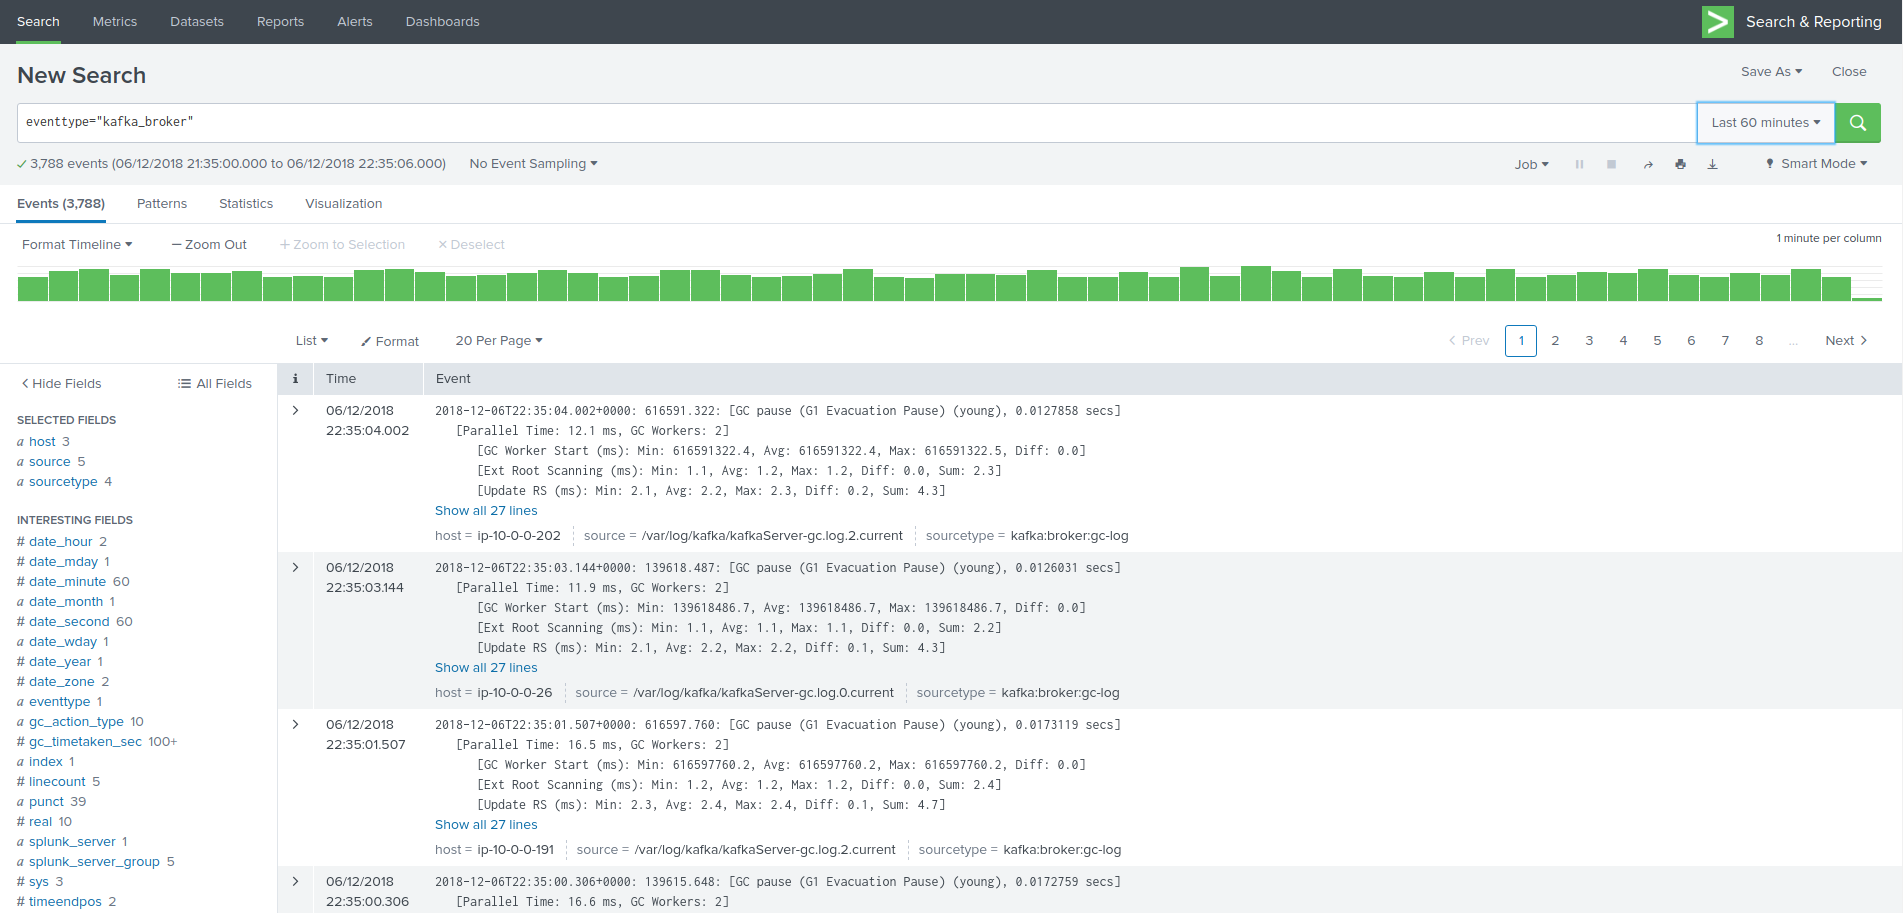
The easiest and first verification is obviously looking at the index content:
index=kafka
Next verification is verifying the eventtypes definition, example:
eventtype=kafka_broker
Events logging in Kubernetes and docker containers
A perfect events logging management requires a different approach in a Kubernetes deployment.
As a basis, each container produces output logging in its standard output, which you can index in Splunk using the Splunk Technical Addon for Kubernetes:
https://splunkbase.splunk.com/app/3991
However, the multi-line management and the differentiation between the different parts of the sub systems logging is a dead end path. (Think about Java stacktraces, garbage collector logging, etc.)
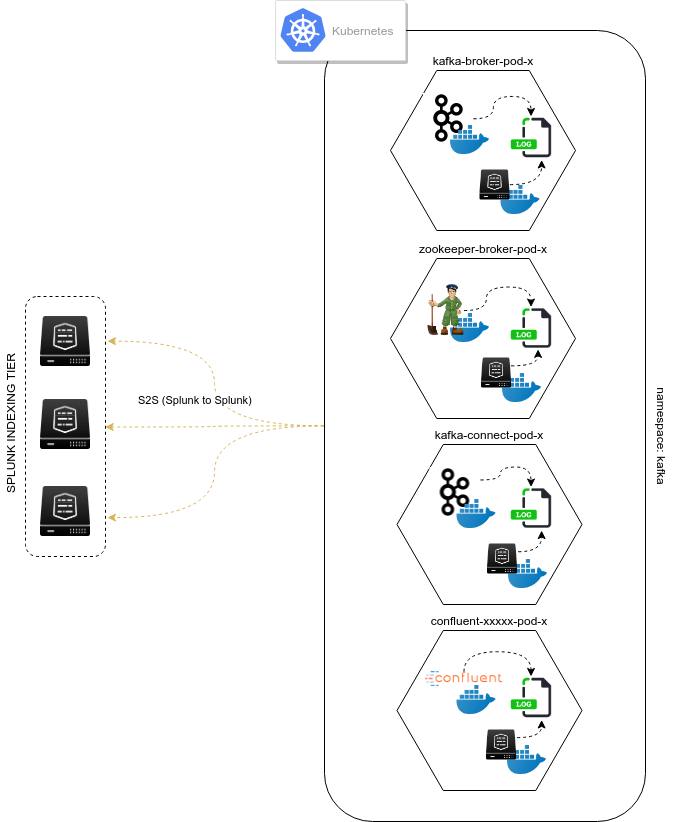
The approach provided is a different approach that is entirely in the philosophy of Kubernetes and Splunk, by using the Kubernetes pods capabilities:
- Each Kafka or Confluent container running in a statefulSet or Deployment is updated to produce logs locally on the container (in addition with its standard output)
- A Splunk Universal Forwarder is created and configured to run in the each pod, which is called a sidecar container (running Splunk Forwarders in a container is now fully supported)
- Splunk Universal Forwarders are connected to your Splunk Deployment infrastructure, and managed just as usual
- The containers running in a same pod automatically share the log directory as a volume, Kafka component produces logs, Splunk monitors these
- Anytime the pod is destroyed and re-created, the Splunk containers is automatically re-created and configured
This is a resilient, scalable and reliable approach that is entirely compatible, relevant and standard with Kubernetes, Kafka and Confluent components, and Splunk.
events logging collection diagram - sidecar Splunk Universal Forwarder containers:
Zookeeper monitoring
Link: Zookeeper logging
Kafka Brokers monitoring
Link: Kafka Brokers logging
Kafka Connect monitoring
Link: Kafka Connect logging