Chapter 2: Metrics
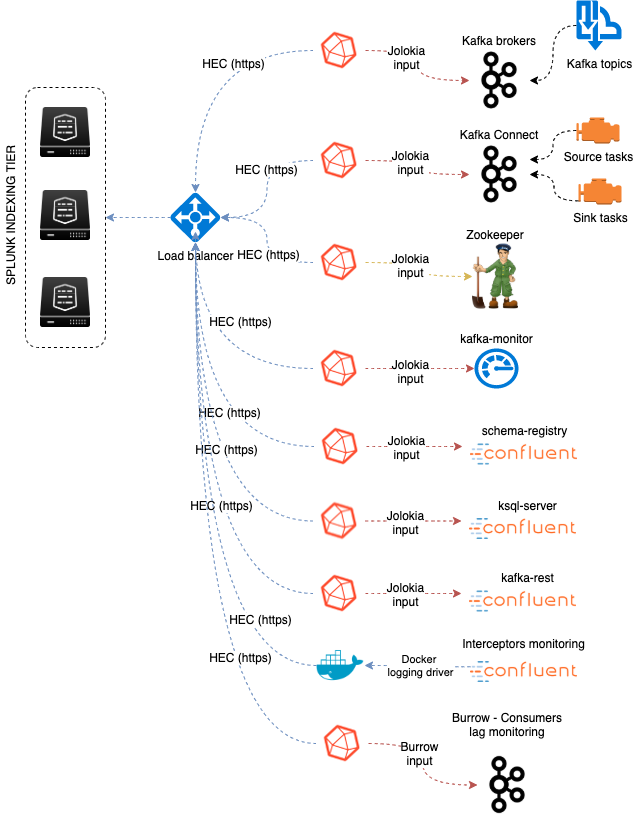
Data collection diagram overview:
Splunk configuration
Index definition
The application relies by default on the creation of a metrics index called “telegraf_kafka”:
indexes.conf example with no Splunk volume::
[telegraf_kafka]
coldPath = $SPLUNK_DB/telegraf_kafka/colddb
datatype = metric
homePath = $SPLUNK_DB/telegraf_kafka/db
thawedPath = $SPLUNK_DB/telegraf_kafka/thaweddb
indexes.conf example with Splunk volumes::
[telegraf_kafka]
coldPath = volume:cold/telegraf_kafka/colddb
datatype = metric
homePath = volume:primary/telegraf_kafka/db
thawedPath = $SPLUNK_DB/telegraf_kafka/thaweddb
In a Splunk distributed configuration (cluster of indexers), this configuration stands on the cluster master node.
All Splunk searches included in the added refer to the utilisation of a macro called “telegraf_kafka_index” configured in:
- telegraf-kafka/default/macros.conf
If you wish to use a different index model, this macro shall be customized to override the default model.
HEC input ingestion and definition
The default recommended way of ingesting the Kafka metrics is using the HTTP Events Collector method which requires the creation of an HEC input.
inputs.conf example:
[http://telegraf_kafka_monitoring]
disabled = 0
index = telegraf_kafka
token = 205d43f1-2a31-4e60-a8b3-327eda49944a
If you create the HEC input via Splunk Web interface, it is not required to select an explicit value for source and sourcetype.
The HEC input will be ideally relying on a load balancer to provides resiliency and load balancing across your HEC input nodes.
Other ingesting methods
There are other methods possible to ingest the Kafka metrics in Splunk:
- TCP input (graphite format with tags support)
- KAFKA ingestion (Kafka destination from Telegraf in graphite format with tags support, and Splunk connect for Kafka)
- File monitoring with standard Splunk input monitors (file output plugin from Telegraf)
Notes: In the very specific context of monitoring Kafka, it is not a good design to use Kafka as the ingestion method since you will most likely never be able to know when an issue happens on Kafka.
These methods require the deployment of an additional Technology addon: https://splunkbase.splunk.com/app/4193
These methods are heavily described here: https://da-itsi-telegraf-os.readthedocs.io/en/latest/telegraf.html
Monitoring Kafka in dedicated servers (bare metal, VMs)

Dedicated servers are bare metal servers or virtual machines that are dedicated to host one or more Kafka roles.
Monitoring the components metrics with Telegraf
Telegraf installation, configuration and start
If you are running Telegraf as a regular process in machine, the standard installation of Telegraf is really straightforward, consult:
If you have a Splunk Universal Forwarder deployment, you can deploy, run and maintain Telegraf and its configuration through a Splunk application (TA), consult:
An example of a ready to use TA application can be found here:
For Splunk customers, this solution has various advantages as you can deploy and maintain using your existing Splunk infrastructure.
Telegraf is extremely container friendly, a container approach is very convenient as you can easily run multiple Telegraf containers to monitor each of the Kafka infrastructure components:
Data collection environment design:
The most scalalable and highly available design in term of where placing the Telegraf instances is to deploy Telegraf locally on each server to be monitored (and collect locally the component) or running as a side car container for Kubernetes based environments.
It is to possible to collect multiple instances of multiple components via a unique Telegraf instance, however there will be a limit where issues can start, and this design will not provide high availability as the failure of this instance will impact the whole metric collection.
Telegraf output and minimal configuration
Whether you will be running Telegraf in various containers, or installed as a regular software within the different servers composing your Kafka infrastructure, a minimal configuration is required to teach Telegraf how to forward the metrics to your Splunk deployment.
Telegraf is able to send to data to Splunk in different ways:
- Splunk HTTP Events Collector (HEC) - Since Telegraf v1.8
- Splunk TCP inputs in Graphite format with tags support and the TA for Telegraf
- Apache Kafka topic in Graphite format with tags support and the TA for Telegraf and Splunk connect for Kafka
Who watches for the watcher?
As you are running a Kafka deployment, it would seem very logical to produce metrics in a Kafka topic. However, it presents a specific concern for Kafka itself.
If you use this same system for monitoring Kafka itself, it is very likely that you will never know when Kafka is broken because the data flow for your monitoring system will be broken as well.
The recommendation is to rely either on Splunk HEC or TCP inputs to forward Telegraf metrics data for the Kafka monitoring.
A minimal configuration for telegraf.conf, running in container or as a regular process in machine and forwarding to HEC:
[global_tags]
  # the env tag is used by the application for multi-environments management
  env = "my_env"
  # the label tag is an optional tag used by the application that you can use as additional label for the services or infrastructure
  label = "my_env_label"

[agent]
  interval = "10s"
  flush_interval = "10s"
  hostname = "$HOSTNAME"

# Regular OS monitoring for Linux OS

# Read metrics about cpu usage
[[inputs.cpu]]
  ## Whether to report per-cpu stats or not
  percpu = true
  ## Whether to report total system cpu stats or not
  totalcpu = true
  ## If true, collect raw CPU time metrics.
  collect_cpu_time = false
  ## If true, compute and report the sum of all non-idle CPU states.
  report_active = false

# Read metrics about disk usage by mount point
[[inputs.disk]]

  ## Ignore mount points by filesystem type.
  ignore_fs = ["tmpfs", "devtmpfs", "devfs"]

# Read metrics about disk IO by device
[[inputs.diskio]]

# Get kernel statistics from /proc/stat
[[inputs.kernel]]

# Read metrics about memory usage
[[inputs.mem]]

# Get the number of processes and group them by status
[[inputs.processes]]

# Read metrics about swap memory usage
[[inputs.swap]]

# Read metrics about system load & uptime
[[inputs.system]]

# # Read metrics about network interface usage
[[inputs.net]]

# # Read TCP metrics such as established, time wait and sockets counts.
[[inputs.netstat]]

# # Monitor process cpu and memory usage
[[inputs.procstat]]
   pattern = ".*"

# outputs
[[outputs.http]]
   url = "https://splunk:8088/services/collector"
   insecure_skip_verify = true
   data_format = "splunkmetric"
    ## Provides time, index, source overrides for the HEC
   splunkmetric_hec_routing = true
    ## Additional HTTP headers
    [outputs.http.headers]
   # Should be set manually to "application/json" for json data_format
      Content-Type = "application/json"
      Authorization = "Splunk 205d43f1-2a31-4e60-a8b3-327eda49944a"
      X-Splunk-Request-Channel = "205d43f1-2a31-4e60-a8b3-327eda49944a"
If for some reasons, you have to use either of the 2 other solutions, please consult:
Notes: The configuration above provides out of the box OS monitoring for the hosts, which can be used by the Operating System monitoring application for Splunk:
Jolokia JVM monitoring
The following Kafka components require Jolokia to be deployed and started, as the modern and efficient interface to JMX that is collected by Telegraf:
- Apache Zookeeper
- Apache Kafka Brokers
- Apache Kafka Connect
- Confluent schema-registry
- Confluent ksql-server
- Confluent kafka-rest
For the complete documentation of Jolokia, see:
Jolokia JVM agent can be started in 2 ways, either as using the -javaagent argument during the start of the JVM, or on the fly by attaching Jolokia to the PID ot the JVM:
Starting Jolokia with the JVM
To start Jolokia agent using the -javaagent argument, use such option at the start of the JVM:
-javaagent:/opt/jolokia/jolokia.jar=port=8778,host=0.0.0.0
Note: This method is the method used in the docker example within this documentation by using the environment variables of the container.
When running on dedicated servers or virtual machines, update the relevant systemd configuration file to start Jolokia automatically:
For Zookeeper
For bare-metals and dedicated VMs:
- Edit:
/lib/systemd/system/confluent-zookeeper.service - Add
-javaagentargument:
[Unit]
Description=Apache Kafka - ZooKeeper
Documentation=http://docs.confluent.io/
After=network.target

[Service]
Type=simple
User=cp-kafka
Group=confluent
ExecStart=/usr/bin/zookeeper-server-start /etc/kafka/zookeeper.properties
Environment="KAFKA_OPTS=-javaagent:/opt/jolokia/jolokia.jar=port=8778,host=0.0.0.0"
Environment="LOG_DIR=/var/log/zookeeper"
TimeoutStopSec=180
Restart=no

[Install]
WantedBy=multi-user.target
- Reload systemd and restart:
sudo systemctl daemon-restart
sudo systemctl restart confluent-zookeeper
For container based environments:
Define the following environment variable when starting the containers:
KAFKA_OPTS: "-javaagent:/opt/jolokia/jolokia.jar=port=8778,host=0.0.0.0"
For Kafka brokers
For bare-metals and dedicated VMs:
- Edit:
/lib/systemd/system/confluent-kafka.service - Add
-javaagentargument:
[Unit]
Description=Apache Kafka - broker
Documentation=http://docs.confluent.io/
After=network.target confluent-zookeeper.target

[Service]
Type=simple
User=cp-kafka
Group=confluent
ExecStart=/usr/bin/kafka-server-start /etc/kafka/server.properties
Environment="KAFKA_OPTS=-javaagent:/opt/jolokia/jolokia.jar=port=8778,host=0.0.0.0"
TimeoutStopSec=180
Restart=no

[Install]
WantedBy=multi-user.target
- Reload systemd and restart:
sudo systemctl daemon-restart
sudo systemctl restart confluent-kafka
For container based environments:
Define the following environment variable when starting the containers:
KAFKA_OPTS: "-javaagent:/opt/jolokia/jolokia.jar=port=8778,host=0.0.0.0"
For Kafka Connect
For bare-metals and dedicated VMs:
- Edit:
/lib/systemd/system/confluent-kafka-connect.service - Add
-javaagentargument:
[Unit]
Description=Apache Kafka Connect - distributed
Documentation=http://docs.confluent.io/
After=network.target confluent-kafka.target

[Service]
Type=simple
User=cp-kafka-connect
Group=confluent
ExecStart=/usr/bin/connect-distributed /etc/kafka/connect-distributed.properties
Environment="KAFKA_OPTS=-javaagent:/opt/jolokia/jolokia.jar=port=8778,host=0.0.0.0"
Environment="LOG_DIR=/var/log/connect"
TimeoutStopSec=180
Restart=no

[Install]
WantedBy=multi-user.target
- Reload systemd and restart:
sudo systemctl daemon-restart
sudo systemctl restart confluent-kafka-connect
For container based environments:
Define the following environment variable when starting the containers:
KAFKA_OPTS: "-javaagent:/opt/jolokia/jolokia.jar=port=8778,host=0.0.0.0"
For Confluent schema-registry
For bare-metals and dedicated VMs:
- Edit:
/lib/systemd/system/confluent-schema-registry.service - Add
-javaagentargument:
[Unit]
Description=RESTful Avro schema registry for Apache Kafka
Documentation=http://docs.confluent.io/
After=network.target confluent-kafka.target

[Service]
Type=simple
User=cp-schema-registry
Group=confluent
Environment="LOG_DIR=/var/log/confluent/schema-registry"
Environment="SCHEMA_REGISTRY_OPTS=-javaagent:/opt/jolokia/jolokia.jar=port=8778,host=0.0.0.0"
ExecStart=/usr/bin/schema-registry-start /etc/schema-registry/schema-registry.properties
TimeoutStopSec=180
Restart=no

[Install]
WantedBy=multi-user.target
- Reload systemd and restart:
sudo systemctl daemon-restart
sudo systemctl restart confluent-schema-registry
For container based environments:
Define the following environment variable when starting the containers:
SCHEMA_REGISTRY_OPTS: "-javaagent:/opt/jolokia/jolokia.jar=port=8778,host=0.0.0.0"
For Confluent ksql-server
For bare-metals and dedicated VMs:
- Edit:
/lib/systemd/system/confluent-ksqldb.service - Add
-javaagentargument:
[Unit]
Description=Streaming SQL engine for Apache Kafka
Documentation=http://docs.confluent.io/
After=network.target confluent-kafka.target confluent-schema-registry.target

[Service]
Type=simple
User=cp-ksql
Group=confluent
Environment="LOG_DIR=/var/log/confluent/ksql"
Environment="KSQL_OPTS=-javaagent:/opt/jolokia/jolokia.jar=port=8778,host=0.0.0.0"
ExecStart=/usr/bin/ksql-server-start /etc/ksqldb/ksql-server.properties
TimeoutStopSec=180
Restart=no

[Install]
WantedBy=multi-user.target
- Reload systemd and restart:
sudo systemctl daemon-restart
sudo systemctl restart confluent-ksqldb
For container based environments:
Define the following environment variable when starting the containers:
KSQL_OPTS: "-javaagent:/opt/jolokia/jolokia.jar=port=8778,host=0.0.0.0"
For Confluent kafka-rest
For bare-metals and dedicated VMs:
- Edit:
/lib/systemd/system/confluent-kafka-rest.service - Add
-javaagentargument:
[Unit]
Description=A REST proxy for Apache Kafka
Documentation=http://docs.confluent.io/
After=network.target confluent-kafka.target

[Service]
Type=simple
User=cp-kafka-rest
Group=confluent
Environment="LOG_DIR=/var/log/confluent/kafka-rest"
Environment="KAFKAREST_OPTS=-javaagent:/opt/jolokia/jolokia.jar=port=8778,host=0.0.0.0"


ExecStart=/usr/bin/kafka-rest-start /etc/kafka-rest/kafka-rest.properties
TimeoutStopSec=180
Restart=no

[Install]
WantedBy=multi-user.target
- Reload systemd and restart:
sudo systemctl daemon-restart
sudo systemctl restart confluent-kafka-rest
For container based environments:
Define the following environment variable when starting the containers:
KAFKAREST_OPTS: "-javaagent:/opt/jolokia/jolokia.jar=port=8778,host=0.0.0.0"
Notes: “KAFKAREST_OPTS” is not a typo, this is the real name of the environment variable for some reason.
Starting Jolokia on the fly
To attach Jolokia agent to an existing JVM, identify its process ID (PID), simplistic example:
ps -ef | grep 'kafka.properties' | grep -v grep | awk '{print $1}'
Then:
java -jar /opt/jolokia/jolokia.jar --host 0.0.0.0 --port 8778 start <PID>
Add this operation to any custom init scripts you use to start the Kafka components.
Zookeeper monitoring
Collecting with Telegraf
The Zookeeper monitoring is very simple and achieved by Telegraf and the Zookeeper input plugin.
The following configuration stands in telegraf.conf and configures the input plugin to monitor multiple Zookeeper servers from one source:
name_prefix = "zk_"
urls = ["http://zookeeper-1:8778/jolokia","http://zookeeper-2:8778/jolokia","http://zookeeper-3:8778/jolokia"]
If each server runs an instance of Zookeeper and you deploy Telegraf, you can simply collect from the localhost:
# Zookeeper JVM monitoring
[[inputs.jolokia2_agent]]
  name_prefix = "zk_"
  urls = ["http://$HOSTNAME:8778/jolokia"]
Full telegraf.conf example
The following telegraf.conf collects a cluster of 3 Zookeeper servers:
[global_tags]
  # the env tag is used by the application for multi-environments management
  env = "my_env"
  # the label tag is an optional tag used by the application that you can use as additional label for the services or infrastructure
  label = "my_env_label"

[agent]
  interval = "10s"
  flush_interval = "10s"
  hostname = "$HOSTNAME"

# outputs
[[outputs.http]]
   url = "https://splunk:8088/services/collector"
   insecure_skip_verify = true
   data_format = "splunkmetric"
    ## Provides time, index, source overrides for the HEC
   splunkmetric_hec_routing = true
    ## Additional HTTP headers
    [outputs.http.headers]
   # Should be set manually to "application/json" for json data_format
      Content-Type = "application/json"
      Authorization = "Splunk 205d43f1-2a31-4e60-a8b3-327eda49944a"
      X-Splunk-Request-Channel = "205d43f1-2a31-4e60-a8b3-327eda49944a"

 # Zookeeper JMX collection

 [[inputs.jolokia2_agent]]
   name_prefix = "zk_"
   urls = ["http://zookeeper-1:8778/jolokia","http://zookeeper-2:8778/jolokia","http://zookeeper-3:8778/jolokia"]

 [[inputs.jolokia2_agent.metric]]
   name  = "quorum"
   mbean = "org.apache.ZooKeeperService:name0=*"
   tag_keys = ["name0"]

 [[inputs.jolokia2_agent.metric]]
   name = "leader"
   mbean = "org.apache.ZooKeeperService:name0=*,name1=*,name2=Leader"
   tag_keys = ["name1"]

 [[inputs.jolokia2_agent.metric]]
   name = "follower"
   mbean = "org.apache.ZooKeeperService:name0=*,name1=*,name2=Follower"
   tag_keys = ["name1"]
Using mcatalog search command to verify data availability:
| mcatalog values(metric_name) values(_dims) where index=* metric_name=zk_*
Kafka brokers monitoring with Jolokia
Collecting with Telegraf
Depending on how you run Kafka and your architecture preferences, you may prefer to collect all the brokers metrics from one Telegraf collector, or installed locally on the Kafka brocker machine.
Connecting to multiple remote Jolokia instances:
# Kafka JVM monitoring
[[inputs.jolokia2_agent]]
  name_prefix = "kafka_"
  urls = ["http://kafka-1:18778/jolokia","http://kafka-2:28778/jolokia","http://kafka-3:38778/jolokia"]
Connecting to the local Jolokia instance:
# Kafka JVM monitoring
[[inputs.jolokia2_agent]]
  name_prefix = "kafka_"
  urls = ["http://$HOSTNAME:8778/jolokia"]
Full telegraf.conf example
The following telegraf.conf collects a cluster of 3 Kafka brokers:
[global_tags]
  # the env tag is used by the application for multi-environments management
  env = "my_env"
  # the label tag is an optional tag used by the application that you can use as additional label for the services or infrastructure
  label = "my_env_label"

[agent]
  interval = "10s"
  flush_interval = "10s"
  hostname = "$HOSTNAME"

# outputs
[[outputs.http]]
   url = "https://splunk:8088/services/collector"
   insecure_skip_verify = true
   data_format = "splunkmetric"
    ## Provides time, index, source overrides for the HEC
   splunkmetric_hec_routing = true
    ## Additional HTTP headers
    [outputs.http.headers]
   # Should be set manually to "application/json" for json data_format
      Content-Type = "application/json"
      Authorization = "Splunk 205d43f1-2a31-4e60-a8b3-327eda49944a"
      X-Splunk-Request-Channel = "205d43f1-2a31-4e60-a8b3-327eda49944a"

# Kafka JVM monitoring

[[inputs.jolokia2_agent]]
  name_prefix = "kafka_"
  urls = ["http://kafka-1:18778/jolokia","http://kafka-2:28778/jolokia","http://kafka-3:38778/jolokia"]

[[inputs.jolokia2_agent.metric]]
  name         = "controller"
  mbean        = "kafka.controller:name=*,type=*"
  field_prefix = "$1."

[[inputs.jolokia2_agent.metric]]
  name         = "replica_manager"
  mbean        = "kafka.server:name=*,type=ReplicaManager"
  field_prefix = "$1."

[[inputs.jolokia2_agent.metric]]
  name         = "purgatory"
  mbean        = "kafka.server:delayedOperation=*,name=*,type=DelayedOperationPurgatory"
  field_prefix = "$1."
  field_name   = "$2"

[[inputs.jolokia2_agent.metric]]
  name     = "client"
  mbean    = "kafka.server:client-id=*,type=*"
  tag_keys = ["client-id", "type"]

[[inputs.jolokia2_agent.metric]]
  name         = "network"
  mbean        = "kafka.network:name=*,request=*,type=RequestMetrics"
  field_prefix = "$1."
  tag_keys     = ["request"]

[[inputs.jolokia2_agent.metric]]
  name         = "network"
  mbean        = "kafka.network:name=ResponseQueueSize,type=RequestChannel"
  field_prefix = "ResponseQueueSize"
  tag_keys     = ["name"]

[[inputs.jolokia2_agent.metric]]
  name         = "network"
  mbean        = "kafka.network:name=NetworkProcessorAvgIdlePercent,type=SocketServer"
  field_prefix = "NetworkProcessorAvgIdlePercent"
  tag_keys     = ["name"]

[[inputs.jolokia2_agent.metric]]
  name         = "topics"
  mbean        = "kafka.server:name=*,type=BrokerTopicMetrics"
  field_prefix = "$1."

[[inputs.jolokia2_agent.metric]]
  name         = "topic"
  mbean        = "kafka.server:name=*,topic=*,type=BrokerTopicMetrics"
  field_prefix = "$1."
  tag_keys     = ["topic"]

[[inputs.jolokia2_agent.metric]]
  name       = "partition"
  mbean      = "kafka.log:name=*,partition=*,topic=*,type=Log"
  field_name = "$1"
  tag_keys   = ["topic", "partition"]

[[inputs.jolokia2_agent.metric]]
  name       = "log"
  mbean      = "kafka.log:name=LogFlushRateAndTimeMs,type=LogFlushStats"
  field_name = "LogFlushRateAndTimeMs"
  tag_keys   = ["name"]

[[inputs.jolokia2_agent.metric]]
  name       = "partition"
  mbean      = "kafka.cluster:name=UnderReplicated,partition=*,topic=*,type=Partition"
  field_name = "UnderReplicatedPartitions"
  tag_keys   = ["topic", "partition"]

[[inputs.jolokia2_agent.metric]]
  name     = "request_handlers"
  mbean    = "kafka.server:name=RequestHandlerAvgIdlePercent,type=KafkaRequestHandlerPool"
  tag_keys = ["name"]

# JVM garbage collector monitoring
[[inputs.jolokia2_agent.metric]]
  name     = "jvm_garbage_collector"
  mbean    = "java.lang:name=*,type=GarbageCollector"
  paths    = ["CollectionTime", "CollectionCount", "LastGcInfo"]
  tag_keys = ["name"]
Using mcatalog search command to verify data availability:
| mcatalog values(metric_name) values(_dims) where index=* metric_name=kafka_*.*
Kafka connect monitoring
Collecting with Telegraf
Connecting to multiple remote Jolokia instances:
# Kafka-connect JVM monitoring
[[inputs.jolokia2_agent]]
  name_prefix = "kafka_connect."
  urls = ["http://kafka-connect-1:18779/jolokia","http://kafka-connect-2:28779/jolokia","http://kafka-connect-3:38779/jolokia"]
Connecting to local Jolokia instance:
# Kafka-connect JVM monitoring
 [[inputs.jolokia2_agent]]
   name_prefix = "kafka_connect."
   urls = ["http://$HOSTNAME:8778/jolokia"]
Full telegraf.conf example
bellow a full telegraf.conf example:
[global_tags]
  # the env tag is used by the application for multi-environments management
  env = "my_env"
  # the label tag is an optional tag used by the application that you can use as additional label for the services or infrastructure
  label = "my_env_label"

[agent]
  interval = "10s"
  flush_interval = "10s"
  hostname = "$HOSTNAME"

# outputs
[[outputs.http]]
   url = "https://splunk:8088/services/collector"
   insecure_skip_verify = true
   data_format = "splunkmetric"
    ## Provides time, index, source overrides for the HEC
   splunkmetric_hec_routing = true
    ## Additional HTTP headers
    [outputs.http.headers]
   # Should be set manually to "application/json" for json data_format
      Content-Type = "application/json"
      Authorization = "Splunk 205d43f1-2a31-4e60-a8b3-327eda49944a"
      X-Splunk-Request-Channel = "205d43f1-2a31-4e60-a8b3-327eda49944a"

# Kafka-connect JVM monitoring

[[inputs.jolokia2_agent]]
  name_prefix = "kafka_connect."
  urls = ["http://kafka-connect-1:18779/jolokia","http://kafka-connect-2:28779/jolokia","http://kafka-connect-3:38779/jolokia"]

[[inputs.jolokia2_agent.metric]]
  name         = "worker"
  mbean        = "kafka.connect:type=connect-worker-metrics"

[[inputs.jolokia2_agent.metric]]
  name         = "worker"
  mbean        = "kafka.connect:type=connect-worker-rebalance-metrics"

[[inputs.jolokia2_agent.metric]]
  name         = "connector-task"
  mbean        = "kafka.connect:type=connector-task-metrics,connector=*,task=*"
  tag_keys = ["connector", "task"]

[[inputs.jolokia2_agent.metric]]
  name         = "sink-task"
  mbean        = "kafka.connect:type=sink-task-metrics,connector=*,task=*"
  tag_keys = ["connector", "task"]

[[inputs.jolokia2_agent.metric]]
  name         = "source-task"
  mbean        = "kafka.connect:type=source-task-metrics,connector=*,task=*"
  tag_keys = ["connector", "task"]

[[inputs.jolokia2_agent.metric]]
  name         = "error-task"
  mbean        = "kafka.connect:type=task-error-metrics,connector=*,task=*"
  tag_keys = ["connector", "task"]

# Kafka connect return a status value which is non numerical
# Using the enum processor with the following configuration replaces the string value by our mapping
[[processors.enum]]
  [[processors.enum.mapping]]
    ## Name of the field to map
    field = "status"

    ## Table of mappings
    [processors.enum.mapping.value_mappings]
      paused = 0
      running = 1
      unassigned = 2
      failed = 3
      destroyed = 4
Using mcatalog search command to verify data availability:
| mcatalog values(metric_name) values(_dims) where index=* metric_name=kafka_connect.*
Kafka LinkedIn monitor - end to end monitoring
Installing and starting the Kafka monitor
LinkedIn provides an extremely powerful open source end to end monitoring solution for Kafka, please consult:
As a builtin configuration, the kafka-monitor implements a jolokia agent, so collecting the metrics with Telegraf cannot be more easy !
It is very straightforward to run the kafka-monitor in a docker container, first you need to create your own image:
In a nutshell, you would:
git clone https://github.com/linkedin/kafka-monitor.git
cd kafka-monitor
./gradlew jar
cd docker
Edit the Makefile to match your needs
make container
make push
Then start your container, example with docker-compose:
kafka-monitor:
image: guilhemmarchand/kafka-monitor:2.0.3
hostname: kafka-monitor
volumes:
  - ../kafka-monitor:/usr/local/share/kafka-monitor
command: "/opt/kafka-monitor/bin/kafka-monitor-start.sh /usr/local/share/kafka-monitor/kafka-monitor.properties"
Once your Kafka monitor is running, you need a Telegraf instance that will be collecting the JMX beans, example:
[global_tags]
  # the env tag is used by the application for multi-environments management
  env = "my_env"
  # the label tag is an optional tag used by the application that you can use as additional label for the services or infrastructure
  label = "my_env_label"

[agent]
  interval = "10s"
  flush_interval = "10s"
  hostname = "$HOSTNAME"

# outputs
[[outputs.http]]
   url = "https://splunk:8088/services/collector"
   insecure_skip_verify = true
   data_format = "splunkmetric"
    ## Provides time, index, source overrides for the HEC
   splunkmetric_hec_routing = true
    ## Additional HTTP headers
    [outputs.http.headers]
   # Should be set manually to "application/json" for json data_format
      Content-Type = "application/json"
      Authorization = "Splunk 205d43f1-2a31-4e60-a8b3-327eda49944a"
      X-Splunk-Request-Channel = "205d43f1-2a31-4e60-a8b3-327eda49944a"

# Kafka JVM monitoring

[[inputs.jolokia2_agent]]
  name_prefix = "kafka_"
  urls = ["http://kafka-monitor:8778/jolokia"]

[[inputs.jolokia2_agent.metric]]
  name         = "kafka-monitor"
  mbean        = "kmf.services:name=*,type=*"
Using mcatalog search command to verify data availability:
| mcatalog values(metric_name) values(_dims) where index=* metric_name=kafka_kafka-monitor.*
Confluent schema-registry
Collecting with Telegraf
Connecting to multiple remote Jolokia instances:
[[inputs.jolokia2_agent]]
  name_prefix = "kafka_schema-registry."
  urls = ["http://schema-registry:18783/jolokia"]
Connecting to local Jolokia instance:
# Kafka-connect JVM monitoring
 [[inputs.jolokia2_agent]]
  name_prefix = "kafka_schema-registry."
   urls = ["http://$HOSTNAME:8778/jolokia"]
Full telegraf.conf example
bellow a full telegraf.conf example:
[global_tags]
  # the env tag is used by the application for multi-environments management
  env = "my_env"
  # the label tag is an optional tag used by the application that you can use as additional label for the services or infrastructure
  label = "my_env_label"

[agent]
  interval = "10s"
  flush_interval = "10s"
  hostname = "$HOSTNAME"

# outputs
[[outputs.http]]
   url = "https://splunk:8088/services/collector"
   insecure_skip_verify = true
   data_format = "splunkmetric"
    ## Provides time, index, source overrides for the HEC
   splunkmetric_hec_routing = true
    ## Additional HTTP headers
    [outputs.http.headers]
   # Should be set manually to "application/json" for json data_format
      Content-Type = "application/json"
      Authorization = "Splunk 205d43f1-2a31-4e60-a8b3-327eda49944a"
      X-Splunk-Request-Channel = "205d43f1-2a31-4e60-a8b3-327eda49944a"

# schema-registry JVM monitoring

[[inputs.jolokia2_agent]]
  name_prefix = "kafka_schema-registry."
  urls = ["http://schema-registry:18783/jolokia"]

[[inputs.jolokia2_agent.metric]]
  name         = "jetty-metrics"
  mbean        = "kafka.schema.registry:type=jetty-metrics"
  paths = ["connections-active", "connections-opened-rate", "connections-closed-rate"]

[[inputs.jolokia2_agent.metric]]
  name         = "master-slave-role"
  mbean        = "kafka.schema.registry:type=master-slave-role"

[[inputs.jolokia2_agent.metric]]
  name         = "jersey-metrics"
  mbean        = "kafka.schema.registry:type=jersey-metrics"
Using mcatalog search command to verify data availability:
| mcatalog values(metric_name) values(_dims) where index=* metric_name=kafka_schema-registry.*
Confluent ksql-server
Collecting with Telegraf
Connecting to multiple remote Jolokia instances:
[[inputs.jolokia2_agent]]
  name_prefix = "kafka_"
  urls = ["http://ksql-server-1:18784/jolokia"]
Connecting to local Jolokia instance:
[[inputs.jolokia2_agent]]
  name_prefix = "kafka_"
  urls = ["http://$HOSTNAME:18784/jolokia"]
Full telegraf.conf example
bellow a full telegraf.conf example:
[global_tags]
  # the env tag is used by the application for multi-environments management
  env = "my_env"
  # the label tag is an optional tag used by the application that you can use as additional label for the services or infrastructure
  label = "my_env_label"

[agent]
  interval = "10s"
  flush_interval = "10s"
  hostname = "$HOSTNAME"

# outputs
[[outputs.http]]
   url = "https://splunk:8088/services/collector"
   insecure_skip_verify = true
   data_format = "splunkmetric"
    ## Provides time, index, source overrides for the HEC
   splunkmetric_hec_routing = true
    ## Additional HTTP headers
    [outputs.http.headers]
   # Should be set manually to "application/json" for json data_format
      Content-Type = "application/json"
      Authorization = "Splunk 205d43f1-2a31-4e60-a8b3-327eda49944a"
      X-Splunk-Request-Channel = "205d43f1-2a31-4e60-a8b3-327eda49944a"

# ksql-server JVM monitoring

 [[inputs.jolokia2_agent]]
   name_prefix = "kafka_"
   urls = ["http://ksql-server:18784/jolokia"]

 [[inputs.jolokia2_agent.metric]]
   name         = "ksql-server"
   mbean        = "io.confluent.ksql.metrics:type=*"
Using mcatalog search command to verify data availability:
| mcatalog values(metric_name) values(_dims) where index=* metric_name=kafka_ksql-server.*
Confluent kafka-rest
Collecting with Telegraf
Connecting to multiple remote Jolokia instances:
[[inputs.jolokia2_agent]]
  name_prefix = "kafka_kafka-rest."
  urls = ["http://kafka-rest:8778/jolokia"]
Connecting to local Jolokia instance:
[[inputs.jolokia2_agent]]
  name_prefix = "kafka_kafka-rest."
  urls = ["http://$HOSTNAME:18785/jolokia"]
Full telegraf.conf example
bellow a full telegraf.conf example:
[global_tags]
  # the env tag is used by the application for multi-environments management
  env = "my_env"
  # the label tag is an optional tag used by the application that you can use as additional label for the services or infrastructure
  label = "my_env_label"

[agent]
  interval = "10s"
  flush_interval = "10s"
  hostname = "$HOSTNAME"

# outputs
[[outputs.http]]
   url = "https://splunk:8088/services/collector"
   insecure_skip_verify = true
   data_format = "splunkmetric"
    ## Provides time, index, source overrides for the HEC
   splunkmetric_hec_routing = true
    ## Additional HTTP headers
    [outputs.http.headers]
   # Should be set manually to "application/json" for json data_format
      Content-Type = "application/json"
      Authorization = "Splunk 205d43f1-2a31-4e60-a8b3-327eda49944a"
      X-Splunk-Request-Channel = "205d43f1-2a31-4e60-a8b3-327eda49944a"

 # kafka-rest JVM monitoring

 [[inputs.jolokia2_agent]]
   name_prefix = "kafka_kafka-rest."
   urls = ["http://kafka-rest:18785/jolokia"]

 [[inputs.jolokia2_agent.metric]]
   name         = "jetty-metrics"
   mbean        = "kafka.rest:type=jetty-metrics"
   paths = ["connections-active", "connections-opened-rate", "connections-closed-rate"]

 [[inputs.jolokia2_agent.metric]]
   name         = "jersey-metrics"
   mbean        = "kafka.rest:type=jersey-metrics"
Using mcatalog search command to verify data availability:
| mcatalog values(metric_name) values(_dims) where index=* metric_name=kafka_kafka_kafka-rest.*
Burrow Lag Consumers
As from their authors, Burrow is a monitoring companion for Apache Kafka that provides consumer lag checking as a service without the need for specifying thresholds.
See: https://github.com/linkedin/Burrow
Burrow workflow diagram:
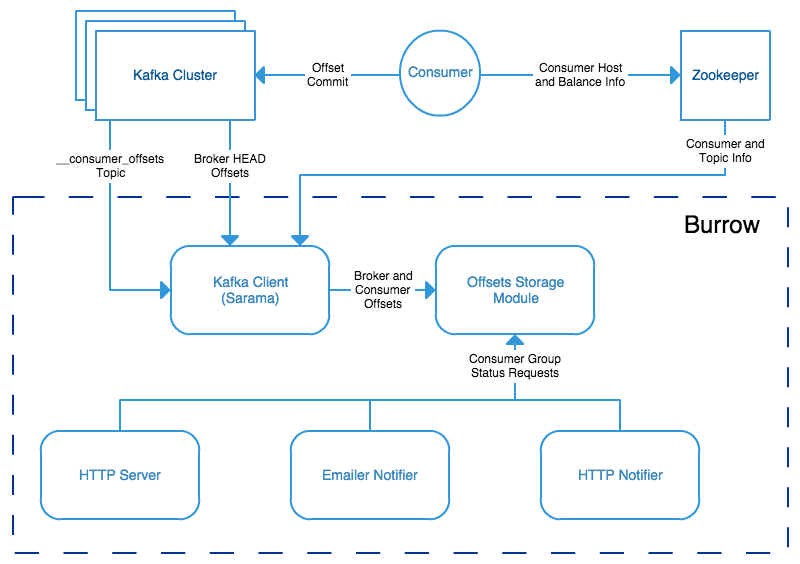
Burrow is a very powerful application that monitors all consumers (Kafka Connect connectors, Kafka Streams…) to report an advanced state of the service automatically, and various useful lagging metrics.
Telegraf has a native input for Burrow which polls consumers, topics and partitions lag metrics and statuses over http, use the following telegraf minimal configuration:
See: https://github.com/influxdata/telegraf/tree/master/plugins/inputs/burrow
[global_tags]
  # the env tag is used by the application for multi-environments management
  env = "my_env"
  # the label tag is an optional tag used by the application that you can use as additional label for the services or infrastructure
  label = "my_env_label"

[agent]
  interval = "10s"
  flush_interval = "10s"
  hostname = "$HOSTNAME"

# outputs
[[outputs.http]]
   url = "https://splunk:8088/services/collector"
   insecure_skip_verify = true
   data_format = "splunkmetric"
    ## Provides time, index, source overrides for the HEC
   splunkmetric_hec_routing = true
    ## Additional HTTP headers
    [outputs.http.headers]
   # Should be set manually to "application/json" for json data_format
      Content-Type = "application/json"
      Authorization = "Splunk 205d43f1-2a31-4e60-a8b3-327eda49944a"
      X-Splunk-Request-Channel = "205d43f1-2a31-4e60-a8b3-327eda49944a"

# Burrow

[[inputs.burrow]]
  ## Burrow API endpoints in format "schema://host:port".
  ## Default is "http://localhost:8000".
  servers = ["http://dockerhost:9001"]

  ## Override Burrow API prefix.
  ## Useful when Burrow is behind reverse-proxy.
  # api_prefix = "/v3/kafka"

  ## Maximum time to receive response.
  # response_timeout = "5s"

  ## Limit per-server concurrent connections.
  ## Useful in case of large number of topics or consumer groups.
  # concurrent_connections = 20

  ## Filter clusters, default is no filtering.
  ## Values can be specified as glob patterns.
  # clusters_include = []
  # clusters_exclude = []

  ## Filter consumer groups, default is no filtering.
  ## Values can be specified as glob patterns.
  # groups_include = []
  # groups_exclude = []

  ## Filter topics, default is no filtering.
  ## Values can be specified as glob patterns.
  # topics_include = []
  # topics_exclude = []

  ## Credentials for basic HTTP authentication.
  # username = ""
  # password = ""

  ## Optional SSL config
  # ssl_ca = "/etc/telegraf/ca.pem"
  # ssl_cert = "/etc/telegraf/cert.pem"
  # ssl_key = "/etc/telegraf/key.pem"
  # insecure_skip_verify = false
Using mcatalog search command to verify data availability:
| mcatalog values(metric_name) values(_dims) where index=* metric_name=burrow_*
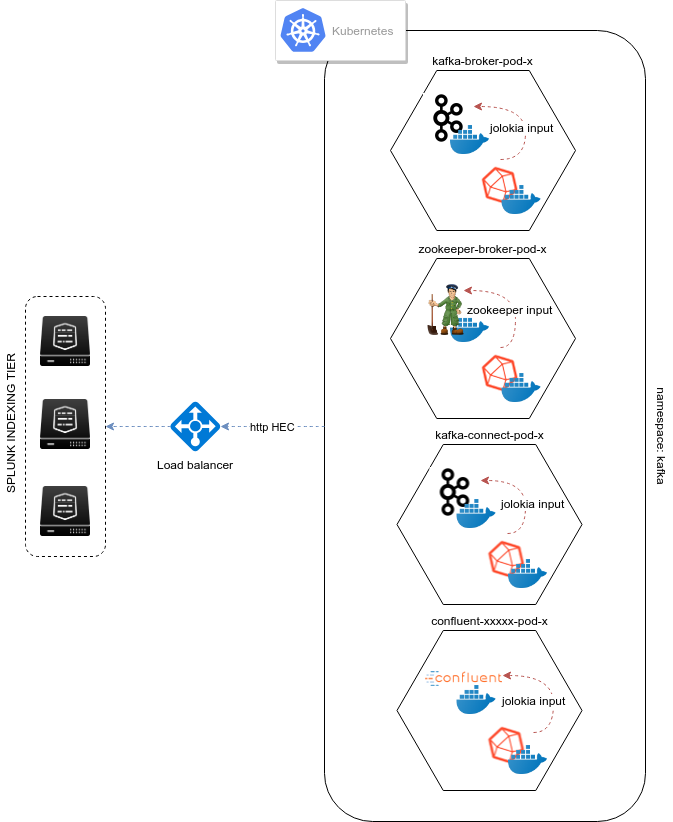
Monitoring Kafka in Kubernetes
For the ease of documentation, this guide assumes you are deploying containers with Kubernetes and Docker, although these instructions can transposed to other containers orchestrator solutions.
3 main steps for implementation:
- Deploying Jolokia jar agent
- Configuring the containers to start with Jolokia
- Deploying the Telegraf containers
metrics collection diagram - sidecar containers:
Deploying Jolokia
The Jolokia agent jar file needs to be available to the pods, you have different possibilities:
- Starting Kubernetes 1.10.0, you can store a binary file in a configMap. As such, it is very easy to load the Jolokia jar file and make it available to your pods. (recommended approach)
- For prior versions, you can automatically mount a persistent volume on the pods such as an NFS volume or a Cloud provider volume that will make the Jolokia jar available to your pods.
- uploading the jar file on every node and mounting a local persistent volume (requires each node to have the jolokia jar uploaded manually)
To download the latest version of Jolokia: https://jolokia.org/reference/html/agents.html#agents-jvm
Option 1: Jolokia jar in configMap
See the files in Github:
From your management server where kubectl is configured, download the latest Jolokia jar file:
curl http://search.maven.org/remotecontent?filepath=org/jolokia/jolokia-jvm/1.6.0/jolokia-jvm-1.6.0-agent.jar -o jolokia.jar
Create a configMap from the binary file:
kubectl create configmap jolokia-jar --from-file=jolokia.jar
From the configMap, optionally create the yml file:
kubectl get configmaps jolokia-jar -o yaml --export > 01-jolokia-jar-configmap.yml
If you need your configMap to be associated with a name space, simply edit the end of the file and add your name space Metadata:
metadata:
  name: jolokia-jar
  namespace: kafka
Modify your definitions to include the volume:
spec:
  volumes:
    - name: jolokia-jar
      configMap:
        name: jolokia-jar
  containers:
    - name: xxxxx
      image: xxxx
      volumeMounts:
        - mountPath: "/opt/jolokia"
          name: jolokia-jar
Finally, update the environment variable to start Jolokia (see next steps) and apply.
Option 2: NFS persistent volume configuration example
Ensure all the nodes have the nfs-common package installed:
For Ubuntu & Debian:
sudo apt-get -y install nfs-common
For RHEL, Centos and derivated:
sudo yum -y install nfs-common
Upload the jar file to your NFS server, and create a share that will be used automatically by the pods, example:
/export/jolokia/jolokia-jvm-1.6.0-agent.jar
Have your share configured in /etc/exports:
/export/jolokia/ *(ro,sync,no_root_squash,subtree_check)
Refresh exports:
sudo exportfs -ra
Create a Kubernetes PersistentVolume:
pv-jolokia.yaml
kind: PersistentVolume
apiVersion: v1
metadata:
  name: pv-jolokia
  labels:
    type: jolokia
spec:
  storageClassName: generic
  capacity:
    storage: 100Mi
  accessModes:
    - ReadOnlyMany
  persistentVolumeReclaimPolicy: Retain
  nfs:
    path: /export/jolokia
    server: <NFS server address>
    readOnly: true
pvc-jolokia.yaml:*
apiVersion: v1
kind: PersistentVolumeClaim
metadata:
  name: pvc-jolokia
spec:
  storageClassName: generic
  accessModes:
  - ReadOnlyMany
  resources:
    requests:
      storage: 100Mi
  selector:
    matchLabels:
      type: jolokia
When you will start your pods, you will specify the PersistentVolumeClaim and the mount options to get Jolokia available on the pods:
kind: Pod
apiVersion: v1
metadata:
  name: xxxxx
spec:
  volumes:
    - name: pv-jolokia
      persistentVolumeClaim:
       claimName: pvc-jolokia
  containers:
    - name: xxxxx
      image: xxxx
      volumeMounts:
        - mountPath: "/opt/jolokia"
          name: pv-jolokia
Option 3: Local persistent volume configuration example
Upload the jar file to each of Kubernetes node, this documentation assumes the agent will be available in /opt/jolokia/, example:
/opt/jolokia/jolokia-jvm-1.6.0-agent.jar
Create a Kubernetes PersistentVolume:
pv-jolokia.yaml
kind: PersistentVolume
apiVersion: v1
metadata:
  name: pv-jolokia
  labels:
    type: jolokia
spec:
  storageClassName: generic
  capacity:
    storage: 100Mi
  accessModes:
    - ReadOnlyMany
  persistentVolumeReclaimPolicy: Retain
  hostPath:
    path: "/opt/jolokia"
Create:
kubectl create -f pv-jolokia.yaml
Create a PersistentVolumeClaim to be used by the pods definition:
pvc-jolokia.yaml:*
apiVersion: v1
kind: PersistentVolumeClaim
metadata:
  name: pvc-jolokia
spec:
  storageClassName: generic
  accessModes:
  - ReadOnlyMany
  resources:
    requests:
      storage: 100Mi
  selector:
    matchLabels:
      type: jolokia
When you will start your pods, you will specify the PersistentVolumeClaim and the mount options to get Jolokia available on the pods:
kind: Pod
apiVersion: v1
metadata:
  name: xxxxx
spec:
  volumes:
    - name: pv-jolokia
      persistentVolumeClaim:
       claimName: pvc-jolokia
  containers:
    - name: xxxxx
      image: xxxx
      volumeMounts:
        - mountPath: "/opt/jolokia"
          name: pv-jolokia
Starting Jolokia with container startup
Kafka brokers
Modify your pod definition:
spec:
  containers:
  - name: xxxxxx
    image: xxxxxx:latest
    env:
    - name: KAFKA_OPTS
      value: "-javaagent:/opt/jolokia/jolokia.jar=port=8778,host=0.0.0.0"
You can use the patch method to update your existing pod definition:
Kafka Connect
Modify your pod definition:
spec:
  containers:
  - name: xxxxxx
    image: xxxxxx:latest
    env:
    - name: KAFKA_OPTS
      value: "-javaagent:/opt/jolokia/jolokia.jar=port=8778,host=0.0.0.0"
You can use the patch method to update your existing pod definition:
Schema registry
Modify your pod definition:
spec:
  containers:
  - name: xxxxxx
    image: xxxxxx:latest
    env:
    - name: SCHEMA_REGISTRY_OPTS
      value: "-javaagent:/opt/jolokia/jolokia.jar=port=8778,host=0.0.0.0"
You can use the patch method to update your existing pod definition:
ksql-server
Modify your pod definition:
spec:
  containers:
  - name: xxxxxx
    image: xxxxxx:latest
    env:
    - name: KSQL_OPTS
      value: "-javaagent:/opt/jolokia/jolokia.jar=port=8778,host=0.0.0.0"
You can use the patch method to update your existing pod definition:
kafka-rest
Modify your pod definition:
spec:
  containers:
  - name: xxxxxx
    image: xxxxxx:latest
    env:
    - name: KAFKAREST_OPTS
      value: "-javaagent:/opt/jolokia/jolokia.jar=port=8778,host=0.0.0.0"
You can use the patch method to update your existing pod definition:
Monitoring the components metrics with Telegraf
Telegraf is a very efficient plugin driven agent collector, in the context of Kubernetes there are several design choices possible:
- Running Telegraf agent as a container in the same pod than the JVM container, called a sidecar container. (recommended approach)
- Running Telegraf agent as a deployment with 1 replica, accessing all JVMs instances via cluster exposed services (one or more deployments if you want to specialise per role, or something else)
Both designs are pertinents, however running collector agents as sidecar containers provides valuable advantages such as ensuring that the collector container will always run on the same node and it is not required to expose any endpoint.
In addition, this is an easy “build and forget” approach, each container monitors the local JVM container automatically, following the same rhythm of destruction and creation.
When running Telegraf as a sidecar container, an additional container will be running in the same pod, generally associated with a StatefulSet or Deployment.
Zookeeper monitoring
Link: Zookeeper metrics
Kafka Brokers monitoring
Link: Kafka Brokers metrics
Kafka Connect monitoring
Link: Kafka Connect metrics