Welcome to the unified guide for Kafka and Confluent monitoring with Splunk
The unified guide for Kafka and Confluent monitoring with Splunk provides a full step by step guidance for monitoring with Splunk, with the following main concepts:
- realtime event logging
- realtime and high performance metric store
- evolutive and efficient alerting
- scalability and resiliency
- compatibility with traditional bare metails/virtual machines deployments and Kubernetes containers deployments
As a basis, the following components are being natively managed:
- Zookeeper
- Apache Kafka Brokers
- Apache Kafka Connect
- Confluent schema-registry
- Confluent ksql-server
- Confluent kafka-rest
- Kafka SLA and end to end monitoring with the Linkedin Kafka monitor
The following components are leveraged:
- Splunk (!)
- Jolokia, connector interface for JMX
- Telegraf, the plugin-driven server agent for collecting & reporting metrics
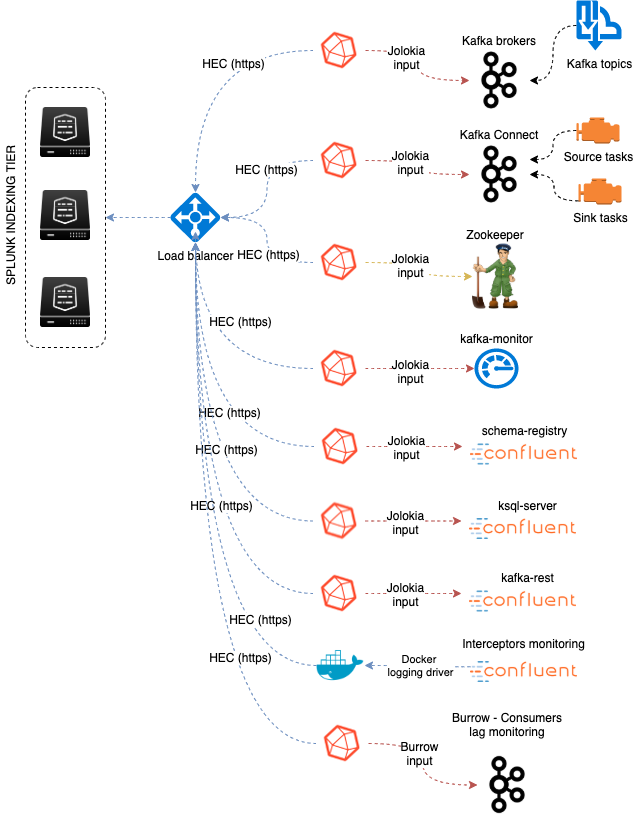
metrics collection diagram example
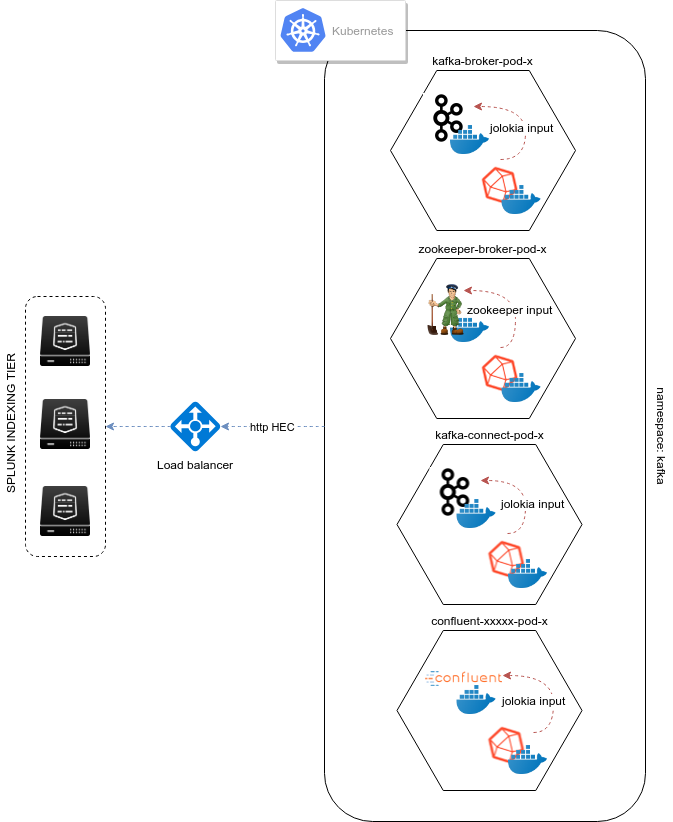
Kubernetes metrics collection diagram - sidecar containers metrics collection by Telegraf to Jolokia:
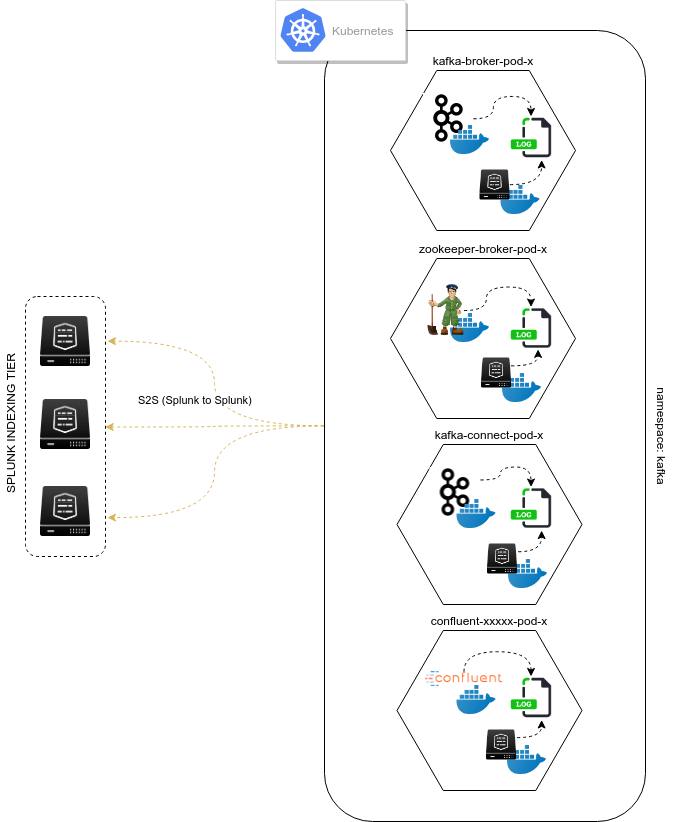
Kubernetes events logging ingestion diagram - sidecar containers Splunk Universal Forwarders reading logs in pod shared volumes: